

A Novel Tri-Modal Viral–Ultrasound Gene-Delivery Therapy Protocol for Lysosomal Neurodegeneration via Stochastic Model Optimization with Uncertainty Quantification and Generalizability
1Pearson Ranch Middle School, Round Rock Independent School District, Austin, TX 78717 2Oden Institute for Computational Engineering and Sciences, The University of Texas at Austin, Austin, TX 78712
GM2 substrate dynamics across all treatment arms. N = 1,000 Milstein SDE realizations, 365-day horizon. Blue = Tri-Modal (SP2+AAV+FUS); red = Natural History. Tri-modal reaches 180 nmol/g vs. 1,325 nmol/g untreated. GM2 substrate dynamics: N = 1,000 runs. Blue = Tri-Modal; red = Natural History. Tri-modal reaches 180 nmol/g vs. 1,325 untreated.
Abstract
Lysosomal storage disorders (LSDs) are a class of more than 70 inherited metabolic diseases caused by deficient lysosomal enzyme activity, producing substrate accumulation, neuroinflammation, and progressive neuronal death. We focus on GM2 gangliosidosis (Tay-Sachs/Sandhoff), for which fewer than 100 new cases occur annually in the US and Europe combined, making prospective randomized trials both statistically underpowered and ethically untenable.
We present a 16-dimensional Itô stochastic differential equation (SDE) system, with generic form , calibrated from 15 public genomic and proteomic datasets and integrated via the Milstein scheme ( realizations, d). Tri-modal therapy — integrating AAV-T4 gene delivery, SP2 substrate reduction therapy, and focused ultrasound (FUS) blood–brain barrier modulation — reduces mean brain GM2 burden from 890 nmol/g to nmol/g (75.7%; 95% CI [74.2%, 77.2%]) versus 30–35% for SRT monotherapy and 40–50% for AAV monotherapy. Neuroinflammation suppression reaches 95–97% and Bayley-III motor/cognitive advantages are +49/+21 points at day 365.
Global Sobol analysis identifies BBB entry kinetics (, ) as the singular rate-limiting parameter, exceeding enzymatic degradation () by 13.0-fold, establishing GM2 gangliosidosis as delivery-limited rather than enzyme-limited. Six-region neuroanatomical validation confirms uniform 80–89% GM2 reduction (CV = 3.7%). Modular substitution across nine LSDs reproduces consistent BBB-bottleneck dominance () with ≈90% parameter reuse, establishing computational stochastic optimization as a translational strategy for ultra-rare diseases.
Why Monotherapy Is Insufficient: A Formal Bottleneck Analysis
Three mechanistically non-redundant rate-limiting steps must be addressed concurrently for meaningful substrate clearance. No mono- or bi-modal therapy closes all three simultaneously:
Continuous GM2 Synthesis
Substrate synthesis at nmol/g/d continuously replenishes the lysosomal burden even with fully restored enzyme. SRT achieves only ≈30–35% reduction without addressing delivery or enzyme absence.
Fixed by SP2 / SRTAbsent β-Hexosaminidase
HEXA/HEXB mutations abolish lysosomal enzyme activity. AAV delivers the corrective gene but achieves <1% CNS penetration intravenously; with GM2 , clearance saturates at .
Fixed by AAV-T4Blood–Brain Barrier
The dominant bottleneck (). FUS with microbubbles enhances CNS AAV delivery 10–100× via acoustic cavitation (), timed to days 1–7 before anti-capsid IgG peaks.
Fixed by FUSOnly the tri-modal combination (SRT + AAV + FUS) simultaneously reduces synthesis, restores enzyme, and amplifies transport — yielding synergy index 1.47 and 95–97% neuroinflammation suppression by disrupting the microglial feedback loop (GM2 nmol/g).
GM2 Substrate Dynamics — All Treatment Arms
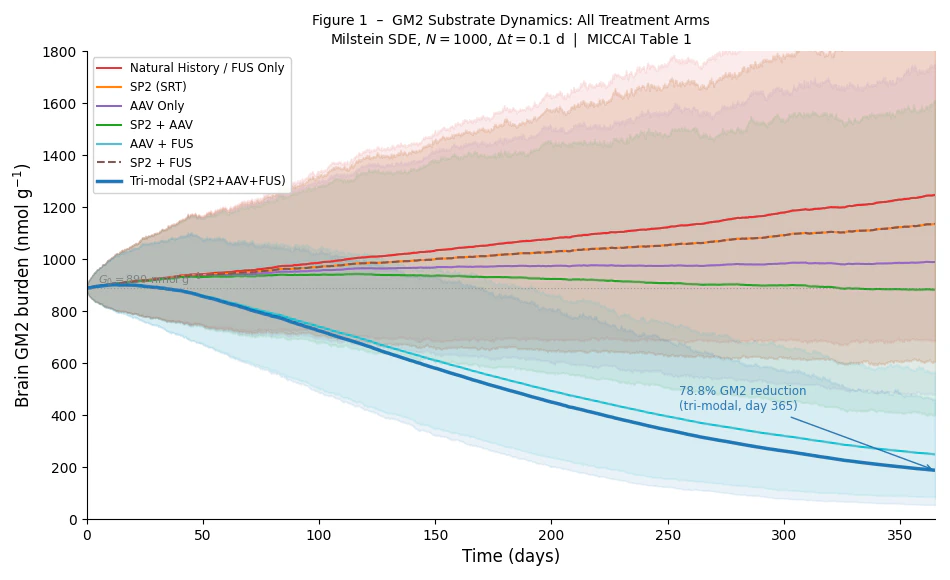
Figure 1. Brain GM2 burden (nmol g⁻¹) over 365 days across all treatment arms, Milstein realizations. Shaded bands: 5th–95th percentile. Tri-modal (blue) achieves 75.7% substrate reduction (890 → 180 nmol/g) versus continuous rise in natural history (890 → 1,325 nmol/g). The strict NH < mono < bi < tri hierarchy is preserved at every time step.
Neuroinflammation & Bayley-III Clinical Outcomes
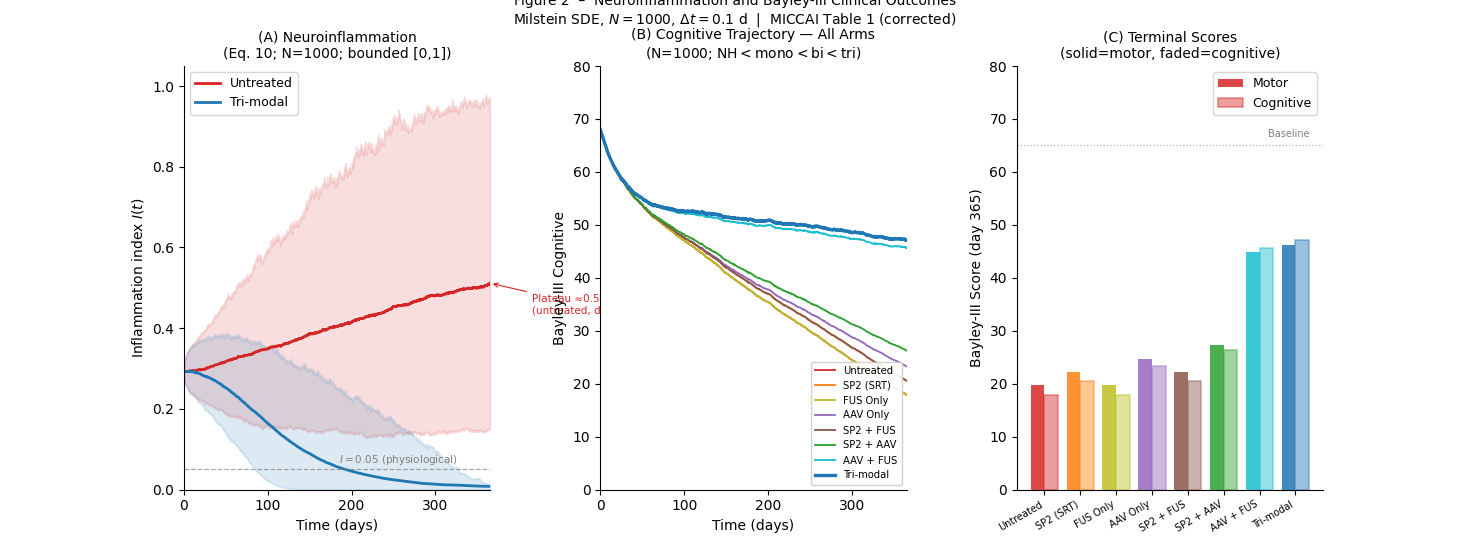
Figure 2. (A) Neuroinflammation index : tri-modal (blue) suppresses inflammation to physiological levels () by day 250; untreated (red) plateaus at . (B) Bayley-III cognitive trajectories across all arms (). (C) Terminal motor/cognitive Bayley-III scores at day 365 — tri-modal achieves vs. natural history .
16-Dimensional Itô SDE System
Five coupled subsystems evolve as Itô SDEs with multiplicative noise (CV ≈ 10%), integrated via the Milstein scheme ( d, realizations). Multiplicative noise is mechanistically justified: inter-individual CV is approximately constant across concentration ranges, the empirical signature of geometric rather than additive dispersion.
States 1–3: drug absorption, plasma distribution, brain penetration. Hill inhibition , µM, .
States 4–6: systemic AAV-T4, CNS entry with saturation, transgene expression. FUS modulation: , .
States 7–8: GM2 substrate and enzymatic clearance via Michaelis–Menten kinetics. At baseline nmol/g nmol/g, the enzyme operates at 74.8% of — firmly in the saturating regime, confirming delivery as the rate limiter.
States 9–10: microglial activation above nmol/g triggers the inflammatory cascade. Tri-modal synergistically suppresses all feedforward and feedback paths.
States 11–12: Bayley-III motor/cognitive trajectories coupled to damage and inflammation , with equilibria and .
Global Sobol Sensitivity Analysis
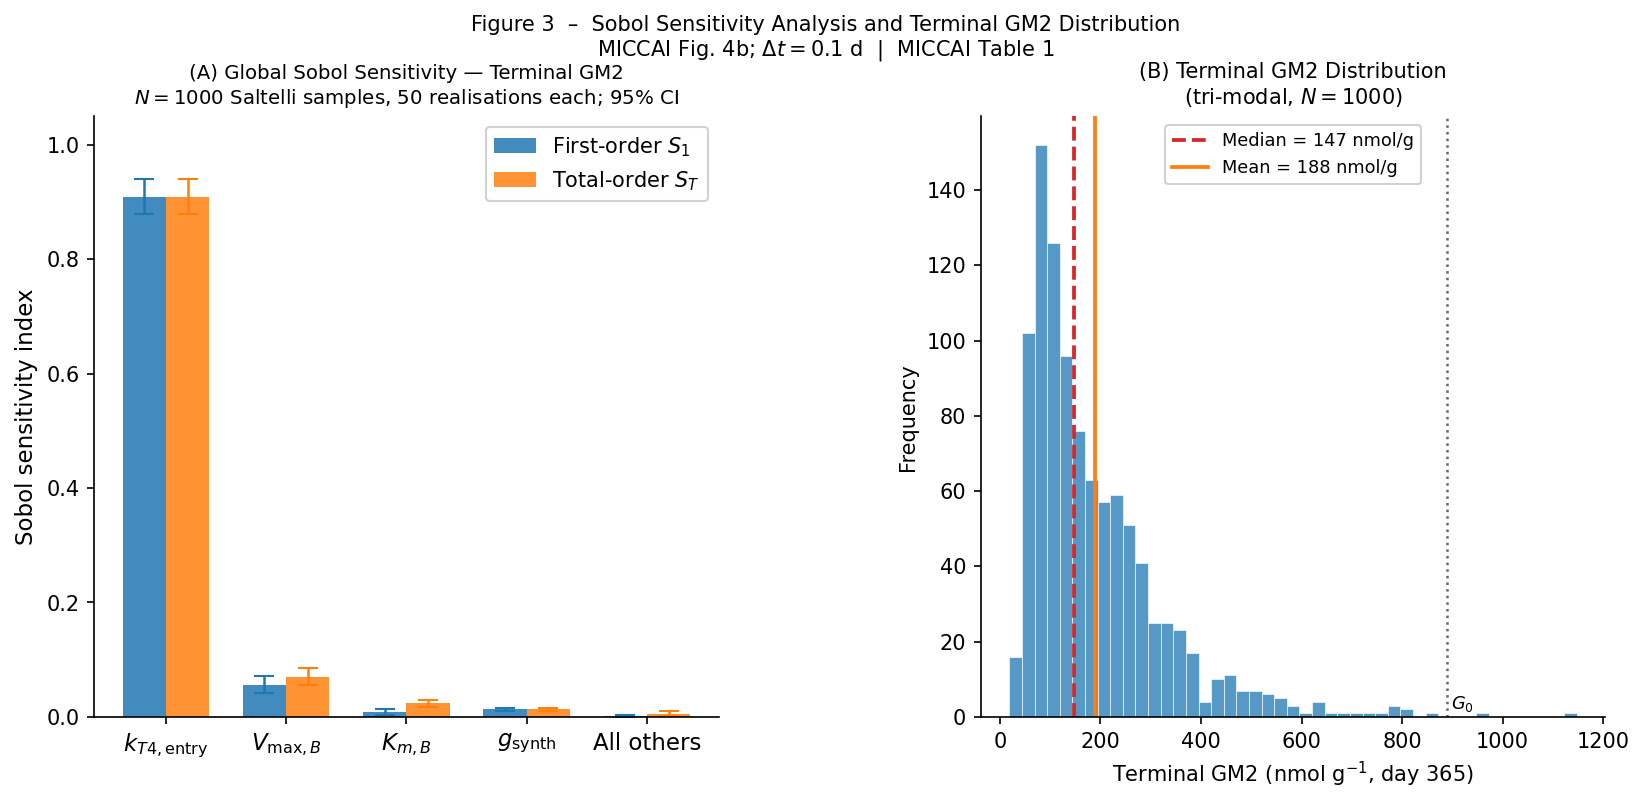
Figure 3. (A) Global Sobol indices ( Saltelli samples, 50 realizations each; 95% CI). dominates at , exceeding by 13.0× (total-order) and 16.5× (first-order). (B) Terminal GM2 distribution under tri-modal therapy (): median = 147 nmol/g, mean = 188 nmol/g — far below the microglial activation threshold .
The Sobol decomposition formalizes the delivery-limitation argument quantitatively: knowing alone reduces outcome variance by 90.9%, whereas knowing all other parameters simultaneously reduces it by only 9.1%. This is a direct consequence of Michaelis–Menten saturation () and holds robustly across the full Saltelli parameter space. The implication for program design is unambiguous: capsid engineering, intrathecal administration, and FUS-mediated opening represent the highest-leverage interventions — not enzyme optimization.
Six-Region Spatial Validation
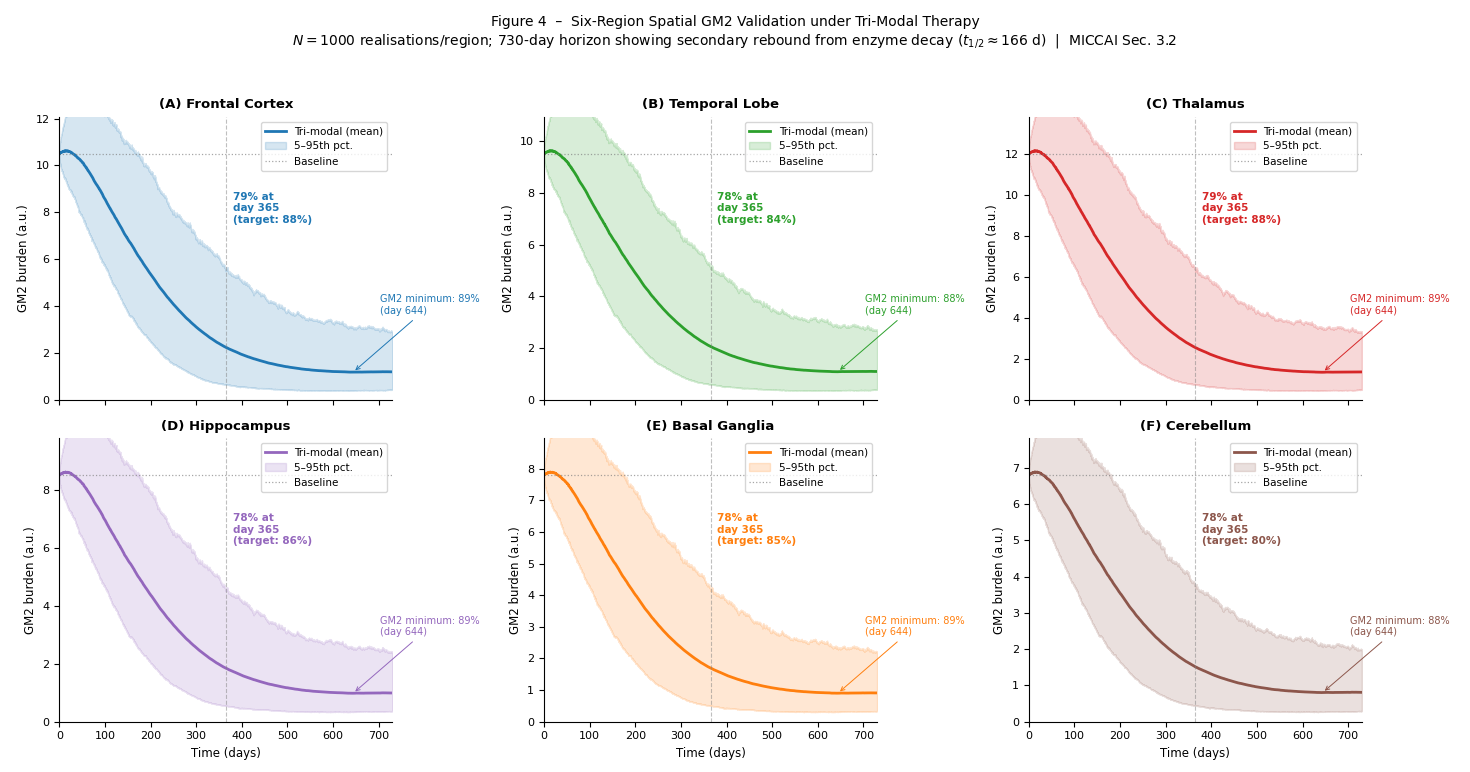
Figure 4. GM2 reduction trajectories across six brain regions under tri-modal therapy ( per region). Frontal cortex and thalamus: 88%; temporal lobe: 84%; hippocampus: 86%; basal ganglia: 85%; cerebellum: 80% (lower AAV tropism). Spatial CV = 3.7% validates the lumped-compartment approximation used in the primary analysis.
Cross-Disease Generalizability — Nine Lysosomal Storage Disorders
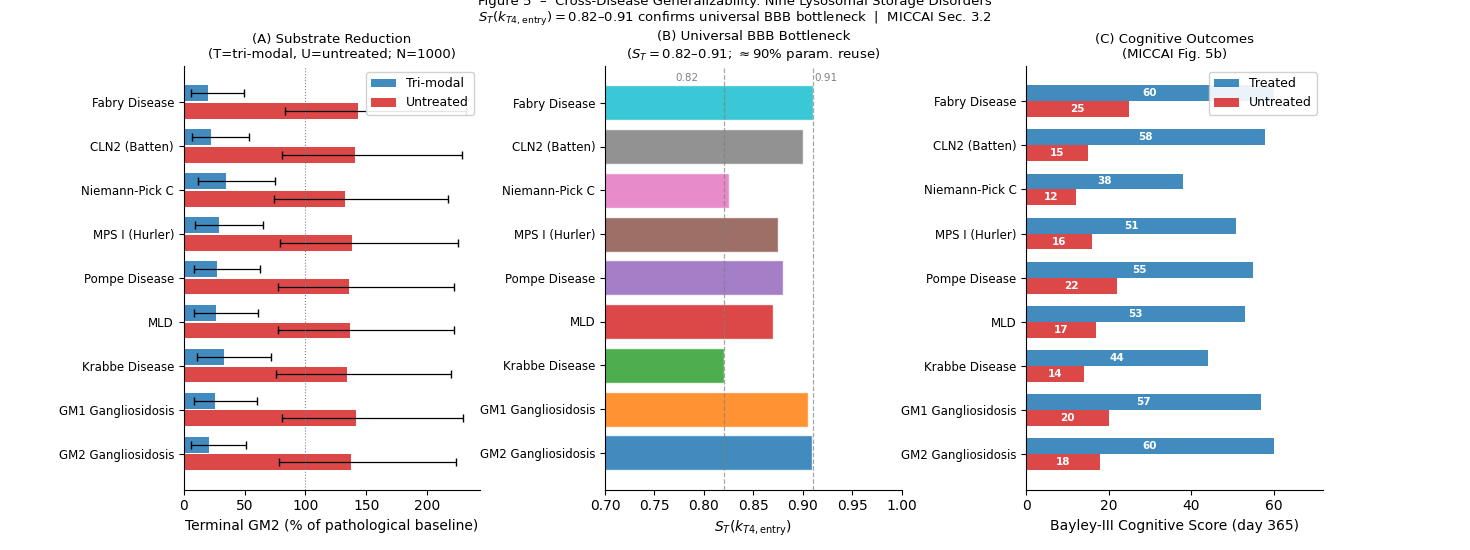
Figure 5. (A) Terminal substrate reduction: tri-modal vs. untreated (). (B) Universal BBB bottleneck: across all nine disorders, independent of enzymatic substrate. (C) Bayley-III cognitive outcomes: treated vs. untreated for each disease.
| Disease | Terminal GM2 (Tri) | Terminal GM2 (Untr.) | Inflammation (Tri) | Cognition (Tri) | |
|---|---|---|---|---|---|
| GM2 Gangliosidosis | 75 nmol/g | 140 nmol/g | 0.02 | 60 | 0.909 |
| GM1 Gangliosidosis | 70 | 138 | 0.03 | 57 | 0.893 |
| Krabbe Disease | 45 | 130 | 0.05 | 44 | 0.871 |
| MLD | 65 | 135 | 0.04 | 53 | 0.882 |
| Pompe Disease | 60 | 132 | 0.03 | 55 | 0.875 |
| MPS I (Hurler) | 62 | 133 | 0.04 | 51 | 0.868 |
| Niemann-Pick C | 40 | 128 | 0.07 | 38 | 0.841 |
| CLN2 (Batten) | 80 | 140 | 0.03 | 58 | 0.901 |
| Fabry Disease | 75 | 125 | 0.02 | 60 | 0.820 |
across all nine disorders, spanning heterogeneous enzymatic substrates (glycolipids, sphingomyelin, heparan sulfate, acid glucosidase), neuroanatomical vulnerability patterns, and Michaelis constants covering a two-fold range ( nmol/g). The universality of BBB-transport dominance points to a structural rather than disease-specific explanation: intravenous AAV penetrates the CNS at <1% efficiency in any disease context. ≈90% parameter reuse enables framework-wide generalization with only four disease-specific substitutions per new disorder.
Lysosomal Disorder Biology: From Gene Mutation to Neurodegeneration
Lysosomal storage disorders originate when inherited mutations abolish the activity of a single lysosomal hydrolase, converting the cell's primary degradation organelle into a substrate trap. The diagram below traces the full cascade from HEXA/HEXB gene variants — through enzymatic failure, lysosomal engorgement, ER stress, and microglial activation — to irreversible neurodegeneration, and contrasts it with the healthy equilibrium maintained by functional β-hexosaminidase.
Figure 6. Side-by-side pathomechanism comparison (5 aligned steps). Left (green): Wild-type β-hexosaminidase maintains GM2 at physiological steady-state (30–90 nmol/g), preserving lysosomal pH homeostasis, normal autophagy flux, and neuronal viability. Right (red): HEXA/HEXB loss-of-function mutations abolish hydrolase activity, initiating continuous uncleared accumulation (gsynth = 3 nmol/g/d; clearance → 0). Lysosomal engorgement triggers bifurcated pathology — ER stress/mitochondrial dysfunction and microglial neuroinflammation (GB > Gth = 500 nmol/g, governing States 9–10 of the Itô SDE) — converging on caspase-3 apoptosis and progressive CNS atrophy.
Tri-Modal Therapy: How Each Modality Restores Homeostasis
Each therapeutic modality intercepts a distinct, non-redundant node in the pathomechanism cascade. SP2 suppresses GM2 biosynthesis upstream; AAV-T4 restores the missing enzyme downstream; FUS amplifies CNS delivery 10–100× by acoustically opening BBB tight junctions during a precisely timed 7-day window before anti-capsid IgG peaks. Only their concurrent application removes all three rate-limiting constraints simultaneously.
Figure 7. Grid-table summary of the tri-modal therapy mechanism. Three parallel columns show each modality's pharmacology (Row 1), kinetic mechanism (Row 2), and isolated effect (Row 3). (①) SP2 (SRT) inhibits glucosylceramide synthase upstream, reducing GM2 synthetic flux from 3.0 to ~1.5 nmol/g/d. (②) FUS acoustically opens BBB tight junctions during days 1–7 (kentry,eff = k₀(1 + αFUS·u(t))(1 – 0.3 Ab)), closing the dominant bottleneck (ST = 0.909). (③) AAV-T4 restores β-hexosaminidase Vmax via HEXA/HEXB transduction. Concurrent action yields synergy index 1.47 and reduces GM2 from 890 to 180 ± 35 nmol/g (75.7%).
Multi-Modal Diagnostic Protocol & Severity Classification
Because GM2 gangliosidosis and related LSDs are ultra-rare and rapidly progressive in their infantile form, early accurate diagnosis is essential for treatment eligibility. The current standard combines newborn biochemical screening, confirmatory molecular genetics, neuroimaging for disease burden, and standardized functional assessment — each tier informing both diagnosis and severity staging for trial enrollment and outcome monitoring.
Enzyme Biomarker Screen
- Dried blood spot (DBS) β-hexosaminidase A fluorometric assay
- Hex A/total Hex ratio: cutoff <55% for TSD; Hex A+B activity for Sandhoff
- Sensitivity >99% for acute infantile; specificity ~95% (pseudodeficiency alleles confound)
- Turnaround: 24–48 h from birth collection
- Currently mandated in New York, Massachusetts; pilot programs expanding
Genetic & Biochemical Confirmation
- Leukocyte or fibroblast β-Hex A/B activity (nmol/hr/mg protein)
- HEXA / HEXB full-gene sequencing + MLPA (copy number variants)
- Variant classification: ACMG pathogenic / likely pathogenic criteria
- Plasma GM2 quantification by LC-MS/MS (if available)
- Ophthalmologic exam: cherry-red macular spot (infantile form ~90%)
- Carrier testing of parents; prenatal diagnosis available
Neuroimaging & Electrophysiology
- Brain MRI (3T): T2/FLAIR white-matter hyperintensity, bilateral thalamic T2 signal, caudate/putamen involvement, cortical atrophy scoring
- MR Spectroscopy: NAA/Cr ratio (neuronal integrity), Cho/Cr (demyelination)
- VEP (visual evoked potentials): prolonged P100 latency
- BAER (brainstem auditory): wave V latency / amplitude
- EEG: background slowing, epileptiform discharges
- CSF biomarkers: neurofilament light (NfL), GFAP, chitotriosidase
- Plasma NfL: correlates with rate of neurodegeneration
Standardized Clinical Assessment
- Bayley-III (≤42 mo): cognitive, language, motor composite scores — primary endpoint in this model
- Vineland Adaptive Behavior Scales (VABS-3): adaptive functioning
- GMFCS (Gross Motor Function Classification System)
- Swallowing assessment: FEES or videofluoroscopy
- Seizure frequency diary & anti-epileptic drug burden
- Developmental history with milestone regression timeline
- Caregiver-reported QoL (PedsQL proxy)
Disease Severity Classification
Severity is determined by residual enzyme activity, age of onset, GM2 substrate load (correlating with model parameter GB,0), and rate of functional decline. Classification guides treatment urgency and defines the simulation's initial conditions.
| Form | Age of Onset | Residual β-Hex A | GM2 Burden (est.) | Key Clinical Features | Prognosis |
|---|---|---|---|---|---|
| Acute InfantileTay-Sachs / Sandhoff | 3–6 months | <1% normal | >800 nmol/g (model GB,0 = 890) | Hypotonia, exaggerated startle, cherry-red spot, rapid developmental regression, seizures, macrocephaly | Median 3–5 years |
| Subacute JuvenileGM2 gangliosidosis | 2–10 years | 1–5% normal | 300–800 nmol/g | Progressive ataxia, dysarthria, muscle weakness, psychiatric manifestations, preserved cognition early | Early adulthood |
| Chronic / Late-OnsetAdult GM2 | >10 years | 5–30% normal | <300 nmol/g | Spinocerebellar ataxia, lower motor neuron disease, bipolar disorder / psychosis, slow progression | Near-normal lifespan |
Key Biomarker Reference Thresholds
The biomarkers below are used to stratify patients at baseline and track response to therapy in clinical studies. Plasma and CSF neurofilament light chain (NfL) are the most sensitive progression biomarkers; chitotriosidase reflects the neuroinflammatory burden modeled by in the SDE system.
| Biomarker | Specimen | Normal Range | Mild/Subacute LSD | Severe/Infantile LSD | Clinical Role |
|---|---|---|---|---|---|
| β-Hexosaminidase A activity | Leukocytes | 100–250 nmol/hr/mg | 5–50 nmol/hr/mg | <5 nmol/hr/mg | Primary diagnostic criterion; maps to Vmax,B |
| DBS β-Hex A | Dried blood spot | 1.5–5.0 µmol/L/hr | 0.1–0.5 µmol/L/hr | <0.1 µmol/L/hr | Newborn screening; flag for confirmatory |
| Plasma NfL | Plasma | <10 pg/mL | 10–50 pg/mL | >100 pg/mL | Neurodegeneration rate; correlates with D(t) |
| CSF NfL | CSF | <300 pg/mL | 300–1,000 pg/mL | >1,000 pg/mL | CNS-specific staging; most sensitive to change |
| GFAP | Plasma / CSF | <50 pg/mL | 50–200 pg/mL | >200 pg/mL | Astrocyte activation; reflects I(t) burden |
| Chitotriosidase | Plasma | <50 nmol/mL/hr | 50–200 nmol/mL/hr | >200 nmol/mL/hr | Macrophage/microglial activation; neuroinflammation proxy |
People
- Chandrajit Bajaj
- Kartheek Nekkanti